 I’ve always run an Apple Content Caching server at home because it is simple to setup and requires no maintenance, so why not!
With a house full of Apple devices we might as well take advantage of the functionality to speed up downloads.
I first started playing with Home Assistant because I wanted an easier interface to visualize my energy usage without logging into Smart Meter Texas.
With built-in integrations for UniFi networking and Pi-hole, a networking dashboard was the next thing on my list to tackle. There isn’t a built-in integration for Apple Content Caching, however with a custom sensor and a LaunchDaemon it is easy to get the data reporting in and visualized.
Read on for the details…
The Approach
I went down a few rabbit holes and dismissed some options like installing a binary via homebrew when I came across a post by “zacs” on the Home Assistant community forums from 2021.
No external dependencies. Easy to implement. This is exactly what I was looking for!
zacs’ approach is simple:
- A custom webhook sensor template in Home Assistant
AssetCacheManagerUtilstatus output in JSON format- A LaunchDaemon to run the command on schedule and use
curlto push it to the Home Assistant webhook
The Sensor
I took zacs’ example and modified it with a few changes.
- I want to make sure I am capturing all output that
AssetCacheManagerUtilprovides, so I added additional sensors. - I want to see the data in GB, not MB, and have it match exactly what you see when running
AssetCacheManagerUtil statuson the CLI in human readable format.
Below is the resulting YAML to add to Home Assistant’s templates.yaml file:
- trigger:
    - platform: webhook
      webhook_id: apple_cache
  sensor:
    # Main cache usage
    - name: "Apple Cache: Actual Cache Used"
      state: "{{ (trigger.json.result.ActualCacheUsed | int / 1000000000) | round(2) }}"
      unit_of_measurement: "GB"
    - name: "Apple Cache: Cache Free"
      state: "{{ (trigger.json.result.CacheFree | int / 1000000000) | round(2) }}"
      unit_of_measurement: "GB"
    - name: "Apple Cache: Cache Used"
      state: "{{ (trigger.json.result.CacheUsed | int / 1000000000) | round(2) }}"
      unit_of_measurement: "GB"
    - name: "Apple Cache: Cache Limit"
      state: "{{ (trigger.json.result.CacheLimit | int / 1000000000) | round(2) }}"
      unit_of_measurement: "GB"

    # CacheDetails breakdown
    - name: "Apple Cache: Cache (iCloud)"
      state: "{{ (trigger.json.result.CacheDetails.iCloud | int / 1000000000) | round(2) }}"
      unit_of_measurement: "GB"
    - name: "Apple Cache: Cache (iOS Software)"
      state: "{{ (trigger.json.result.CacheDetails['iOS Software'] | int / 1000000000) | round(2) }}"
      unit_of_measurement: "GB"
    - name: "Apple Cache: Cache (Mac Software)"
      state: "{{ (trigger.json.result.CacheDetails['Mac Software'] | int / 1000000000) | round(2) }}"
      unit_of_measurement: "GB"
    - name: "Apple Cache: Cache (Movies)"
      state: "{{ (trigger.json.result.CacheDetails.Movies | int / 1000000000) | round(2) }}"
      unit_of_measurement: "GB"
    - name: "Apple Cache: Cache (Other)"
      state: "{{ (trigger.json.result.CacheDetails.Other | int / 1000000000) | round(2) }}"
      unit_of_measurement: "GB"

    # Max pressure
    - name: "Apple Cache: Maximum Pressure (past hour)"
      state: "{{ trigger.json.result.MaxCachePressureLast1Hour }}"
      unit_of_measurement: "%"

    # Personal cache
    - name: "Apple Cache: Personal Cache Free"
      state: "{{ (trigger.json.result.PersonalCacheFree | int / 1000000000) | round(2) }}"
      unit_of_measurement: "GB"
    - name: "Apple Cache: Personal Cache Limit"
      state: "{{ (trigger.json.result.PersonalCacheLimit | int / 1000000000) | round(2) }}"
      unit_of_measurement: "GB"
    - name: "Apple Cache: Personal Cache Used"
      state: "{{ (trigger.json.result.PersonalCacheUsed | int / 1000000000) | round(2) }}"
      unit_of_measurement: "GB"

    # TotalBytes metrics
    - name: "Apple Cache: Stored From Origin"
      state: "{{ (trigger.json.result.TotalBytesStoredFromOrigin | int / 1000000000) | round(2) }}"
      unit_of_measurement: "GB"
    - name: "Apple Cache: Stored From Parents"
      state: "{{ (trigger.json.result.TotalBytesStoredFromParents | int / 1000000000) | round(2) }}"
      unit_of_measurement: "GB"
    - name: "Apple Cache: Stored From Peers"
      state: "{{ (trigger.json.result.TotalBytesStoredFromPeers | int / 1000000000) | round(2) }}"
      unit_of_measurement: "GB"
    - name: "Apple Cache: Dropped"
      state: "{{ (trigger.json.result.TotalBytesDropped | int / 1000000000) | round(2) }}"
      unit_of_measurement: "GB"
    - name: "Apple Cache: Served to Clients"
      state: "{{ (trigger.json.result.TotalBytesReturnedToClients | int / 1000000000) | round(2) }}"
      unit_of_measurement: "GB"
    - name: "Apple Cache: Returned to Children"
      state: "{{ (trigger.json.result.TotalBytesReturnedToChildren | int / 1000000000) | round(2) }}"
      unit_of_measurement: "GB"
    - name: "Apple Cache: Returned to Peers"
      state: "{{ (trigger.json.result.TotalBytesReturnedToPeers | int / 1000000000) | round(2) }}"
      unit_of_measurement: "GB"
    - name: "Apple Cache: Imported"
      state: "{{ (trigger.json.result.TotalBytesImported | int / 1000000000) | round(2) }}"
      unit_of_measurement: "GB"

  binary_sensor:
    - name: "Apple Cache Active"
      state: "{{ trigger.json.result.Active }}"
    - name: "Apple Cache Activated"
      state: "{{ trigger.json.result.Activated }}"
The LaunchDaemon
Next we need a LaunchDaemon to run on the Mac hosting the content cache that will grab the data on a schedule and push it to Home Assistant.
Again a few tweaks were needed from the old post to add logging and I decided on a five minute interval to push data.
Below is an example LaunchDaemon that can used on your content caching server:
<?xml version="1.0" encoding="UTF-8"?>
<!DOCTYPE plist PUBLIC "-//Apple//DTD PLIST 1.0//EN"
  "http://www.apple.com/DTDs/PropertyList-1.0.dtd">
<plist version="1.0">
<dict>
	<key>Label</key>
	<string>com.example.applecache</string>
	<key>StartInterval</key>
	<integer>300</integer>
	<key>RunAtLoad</key>
	<true/>
	<key>ProgramArguments</key>
	<array>
		<string>/bin/bash</string>
		<string>-c</string>
		<string>/usr/bin/AssetCacheManagerUtil status -j | /usr/bin/curl -f -s -H "Content-Type: application/json" -X POST --data-binary @- http://192.168.1.1:8123/api/webhook/apple_cache && echo "$(date) Apple Cache POST OK"</string>
	</array>
	<key>StandardOutPath</key>
	<string>/var/log/apple_cache_ha.log</string>
	<key>StandardErrorPath</key>
	<string>/var/log/apple_cache_ha.err</string>
</dict>
</plist>
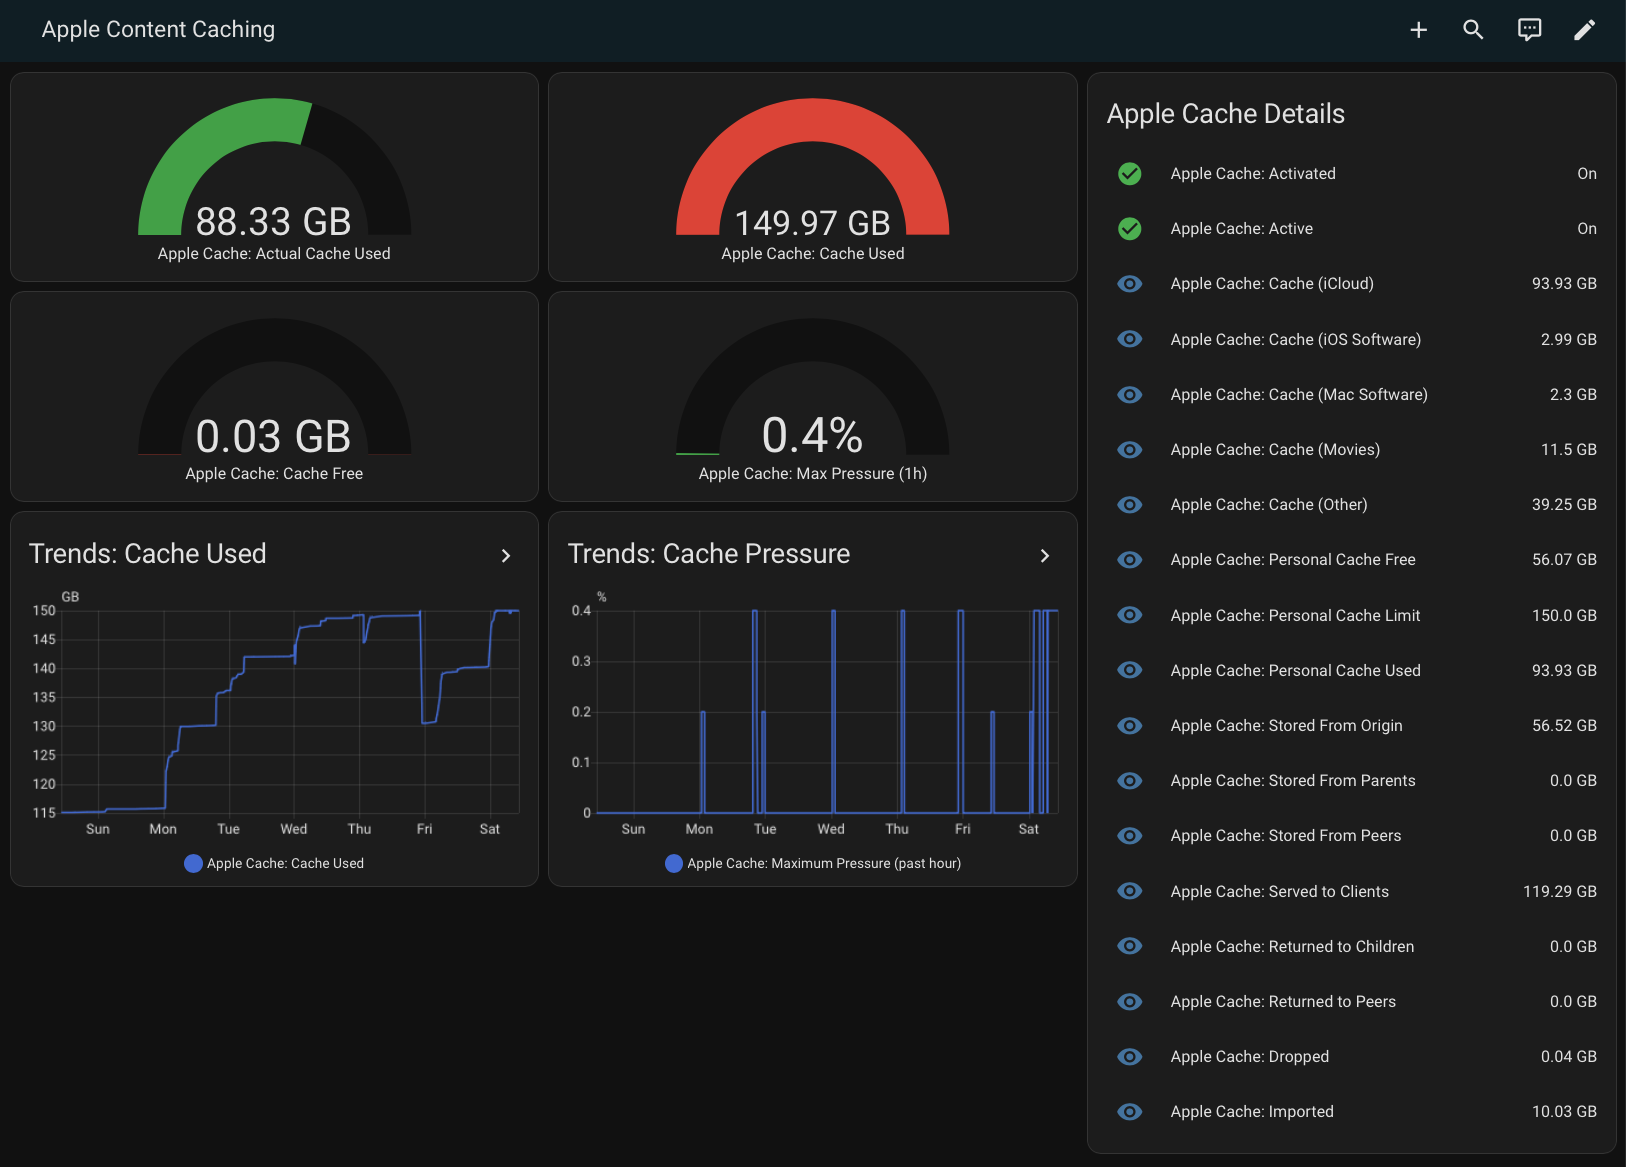
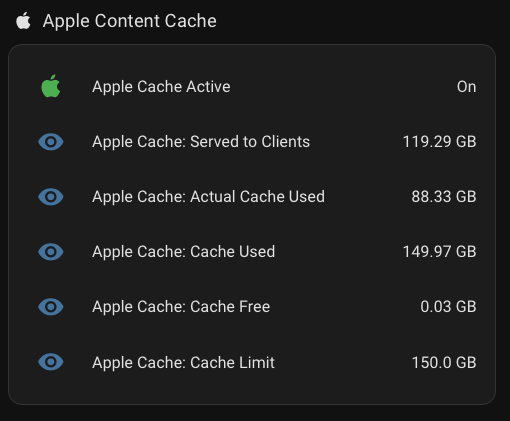
The Dashboard
Lastly we need to display the data in Home Assistant. I decided to add a small section with the most relevant tiles on my Networking dashboard, but I also to created a full dashboard dedicated to see everything related to the content cache.
The YAML for the full dashboard is below:
views:
  - title: Apple Content Caching
    path: apple_cache
    badges: []
    cards:
      - type: gauge
        entity: sensor.apple_cache_actual_cache_used
        name: 'Apple Cache: Actual Cache Used'
        unit: GB
        min: 0
        max: 150
        severity:
          green: 0
          yellow: 100
          red: 130
      - type: gauge
        entity: sensor.apple_cache_cache_free
        name: 'Apple Cache: Cache Free'
        unit: GB
        min: 0
        max: 150
        severity:
          green: 100
          yellow: 50
          red: 0
      - type: gauge
        entity: sensor.apple_cache_cache_used
        name: 'Apple Cache: Cache Used'
        unit: GB
        min: 0
        max: 150
        severity:
          green: 0
          yellow: 100
          red: 130
      - type: gauge
        entity: sensor.apple_cache_maximum_pressure_past_hour
        name: 'Apple Cache: Max Pressure (1h)'
        unit: '%'
        min: 0
        max: 100
        severity:
          green: 0
          yellow: 50
          red: 80
      - type: entities
        title: Apple Cache Details
        show_header_toggle: false
        state_color: true
        entities:
          - entity: binary_sensor.apple_cache_activated
            name: 'Apple Cache: Activated'
          - entity: binary_sensor.apple_cache_active
            name: 'Apple Cache: Active'
          - entity: sensor.apple_cache_cache_icloud
            name: 'Apple Cache: Cache (iCloud)'
          - entity: sensor.apple_cache_cache_ios_software
            name: 'Apple Cache: Cache (iOS Software)'
          - entity: sensor.apple_cache_cache_mac_software
            name: 'Apple Cache: Cache (Mac Software)'
          - entity: sensor.apple_cache_cache_movies
            name: 'Apple Cache: Cache (Movies)'
          - entity: sensor.apple_cache_cache_other
            name: 'Apple Cache: Cache (Other)'
          - entity: sensor.apple_cache_personal_cache_free
            name: 'Apple Cache: Personal Cache Free'
          - entity: sensor.apple_cache_personal_cache_limit
            name: 'Apple Cache: Personal Cache Limit'
          - entity: sensor.apple_cache_personal_cache_used
            name: 'Apple Cache: Personal Cache Used'
          - entity: sensor.apple_cache_stored_from_origin
            name: 'Apple Cache: Stored From Origin'
          - entity: sensor.apple_cache_stored_from_parents
            name: 'Apple Cache: Stored From Parents'
          - entity: sensor.apple_cache_stored_from_peers
            name: 'Apple Cache: Stored From Peers'
          - entity: sensor.apple_cache_served_to_clients
            name: 'Apple Cache: Served to Clients'
          - entity: sensor.apple_cache_returned_to_children
            name: 'Apple Cache: Returned to Children'
          - entity: sensor.apple_cache_returned_to_peers
            name: 'Apple Cache: Returned to Peers'
          - entity: sensor.apple_cache_dropped
            name: 'Apple Cache: Dropped'
          - entity: sensor.apple_cache_imported
            name: 'Apple Cache: Imported'
      - type: history-graph
        title: 'Trends: Cache Used'
        entities:
          - sensor.apple_cache_cache_used
        hours_to_show: 168
        refresh_interval: 5
      - type: history-graph
        title: 'Trends: Cache Pressure'
        entities:
          - sensor.apple_cache_maximum_pressure_past_hour
        hours_to_show: 168
        refresh_interval: 5
    type: masonry
The Result
The result are some easy to read charts that let me keep on eye on how effective the Apple Content Caching is with minimal effort. I’m pretty happy with the results: